Digging Up Signal from the Noise: How Real-Time Utilization Tracking Can Save Your MLR
by Yubin Park, Co-Founder / CTO
Healthcare payers have been blindsided by unexpected utilization trends over the past few years, with Medical Loss Ratios (MLRs) taking devastating hits. The challenge isn't just the volatility. It's the lag. By the time most organizations discover utilization spikes, the financial damage is already done. This lag also makes fraud detection and overutilization monitoring extremely difficult. Suspicious patterns that should trigger immediate investigation instead go undetected for months.
Top tip
In this blog post, we share how Falcon's enhanced completion factor methodology and dynamic service grouping capabilities tackle these common challenges, enabling real-time detection of utilization anomalies before they impact your bottom line.
The High Cost of Flying Blind
A health plan notices an unusual spike in specialty procedure claims in their Q3 financial reports. The spike actually occurred in Q1, but lengthy claim filing periods meant the data only surfaced months later. By then, the budget impact was locked in, reserves were insufficient, and there was no opportunity for proactive intervention.
This isn't an edge case. It's the norm. Accurate utilization forecasting drives financial reserves, network capacity planning, and early intervention strategies.
The Completion Factor Approach: A Foundation with Limitations
Most healthcare organizations rely on completion factor methodology for utilization estimation. If you're analyzing June claims at the end of June, you know only a fraction of that month's services have been filed yet. Providers need time to review cases, maximize revenue coding, and process paperwork.
Historically, you might find that 30-40% of claims arrive within the same month they're incurred (though this varies significantly by service type). Using this completion factor, you can estimate total June utilization by applying the appropriate multiplier to the claims you've received so far. It's a reasonable starting point, but it's also where most organizations stop.
Why One-Size-Fits-All Doesn't Work
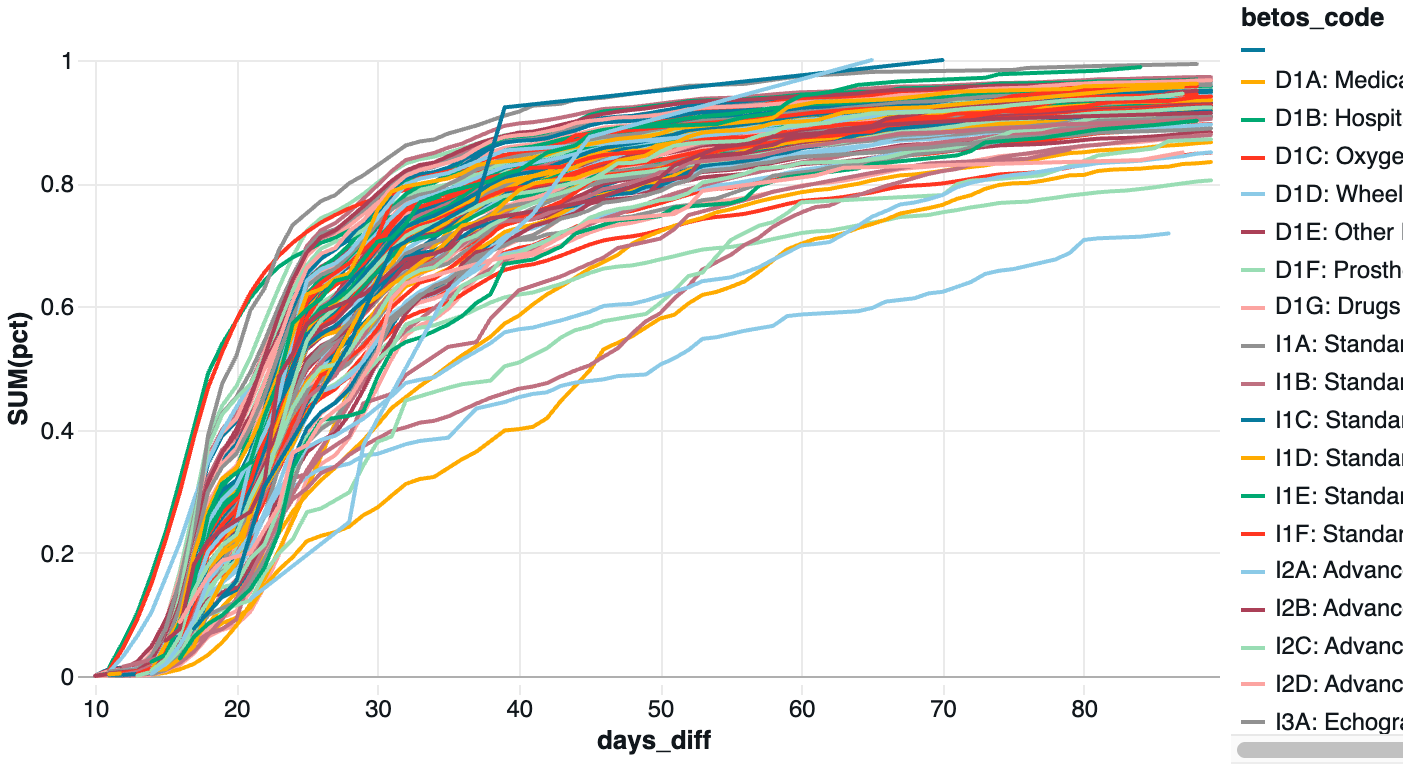
Completion factors vary dramatically across service types and provider categories. Simple medical supplies reach near-complete reporting within 30 days, while complex imaging procedures can take 60-90 days to reach full completion.
The chart below demonstrates this variation across BETOS categories. A telehealth visit might be coded and submitted within days, while a complex surgical procedure involving multiple specialists could take months to generate its final claim.
The Falcon Advantage: Dynamic, Context-Aware Forecasting
At Falcon, we've pushed completion factor methodology to its limits by making it dynamic and context-aware. Instead of applying static historical averages, we account for:
- Provider-specific filing patterns: Each provider's historical submission timeline
- Service complexity indicators: Procedure codes, authorization requirements, and typical documentation needs
- Seasonal variations: How filing patterns change during different times of year
- Real-time calibration: Continuous adjustment based on emerging data patterns
Beyond Static Categories: The Fraud Detection Challenge
The lag problem becomes even more complex when it comes to fraud detection, because fraudulent schemes rarely follow traditional service category boundaries. A sophisticated billing fraud might involve a specific combination of diagnostic codes, imaging procedures, and follow-up visits that spans multiple BETOS categories.
Traditional healthcare analytics relies on static groupings (BETOS codes, DRGs, or custom categories defined once and rarely updated), but fraud patterns evolve constantly. Bad actors learn to avoid triggers in existing monitoring systems by spreading suspicious activity across different service categories.
One of Falcon's core differentiators is our dynamic approach to service grouping. We continuously identify new service clusters based on real-time utilization patterns, provider behaviors, and anomaly detection. When a suspicious pattern emerges involving a specific combination of procedures and providers, our system automatically begins tracking that cluster and calculating appropriate completion factors for early detection.
This adaptive grouping means we're not just estimating completion factors more accurately. We're discovering new patterns that traditional fixed-category approaches would miss entirely.
Top tip
Here's the secret sauce: While others apply static completion factors to predetermined categories, we dynamically identify new service clusters as they emerge. When fraud schemes evolve or new care models develop, our system automatically begins tracking those patterns and calculating tailored completion factors, no manual reconfiguration required.
Real-World Impact: The Drug and Infusion Example
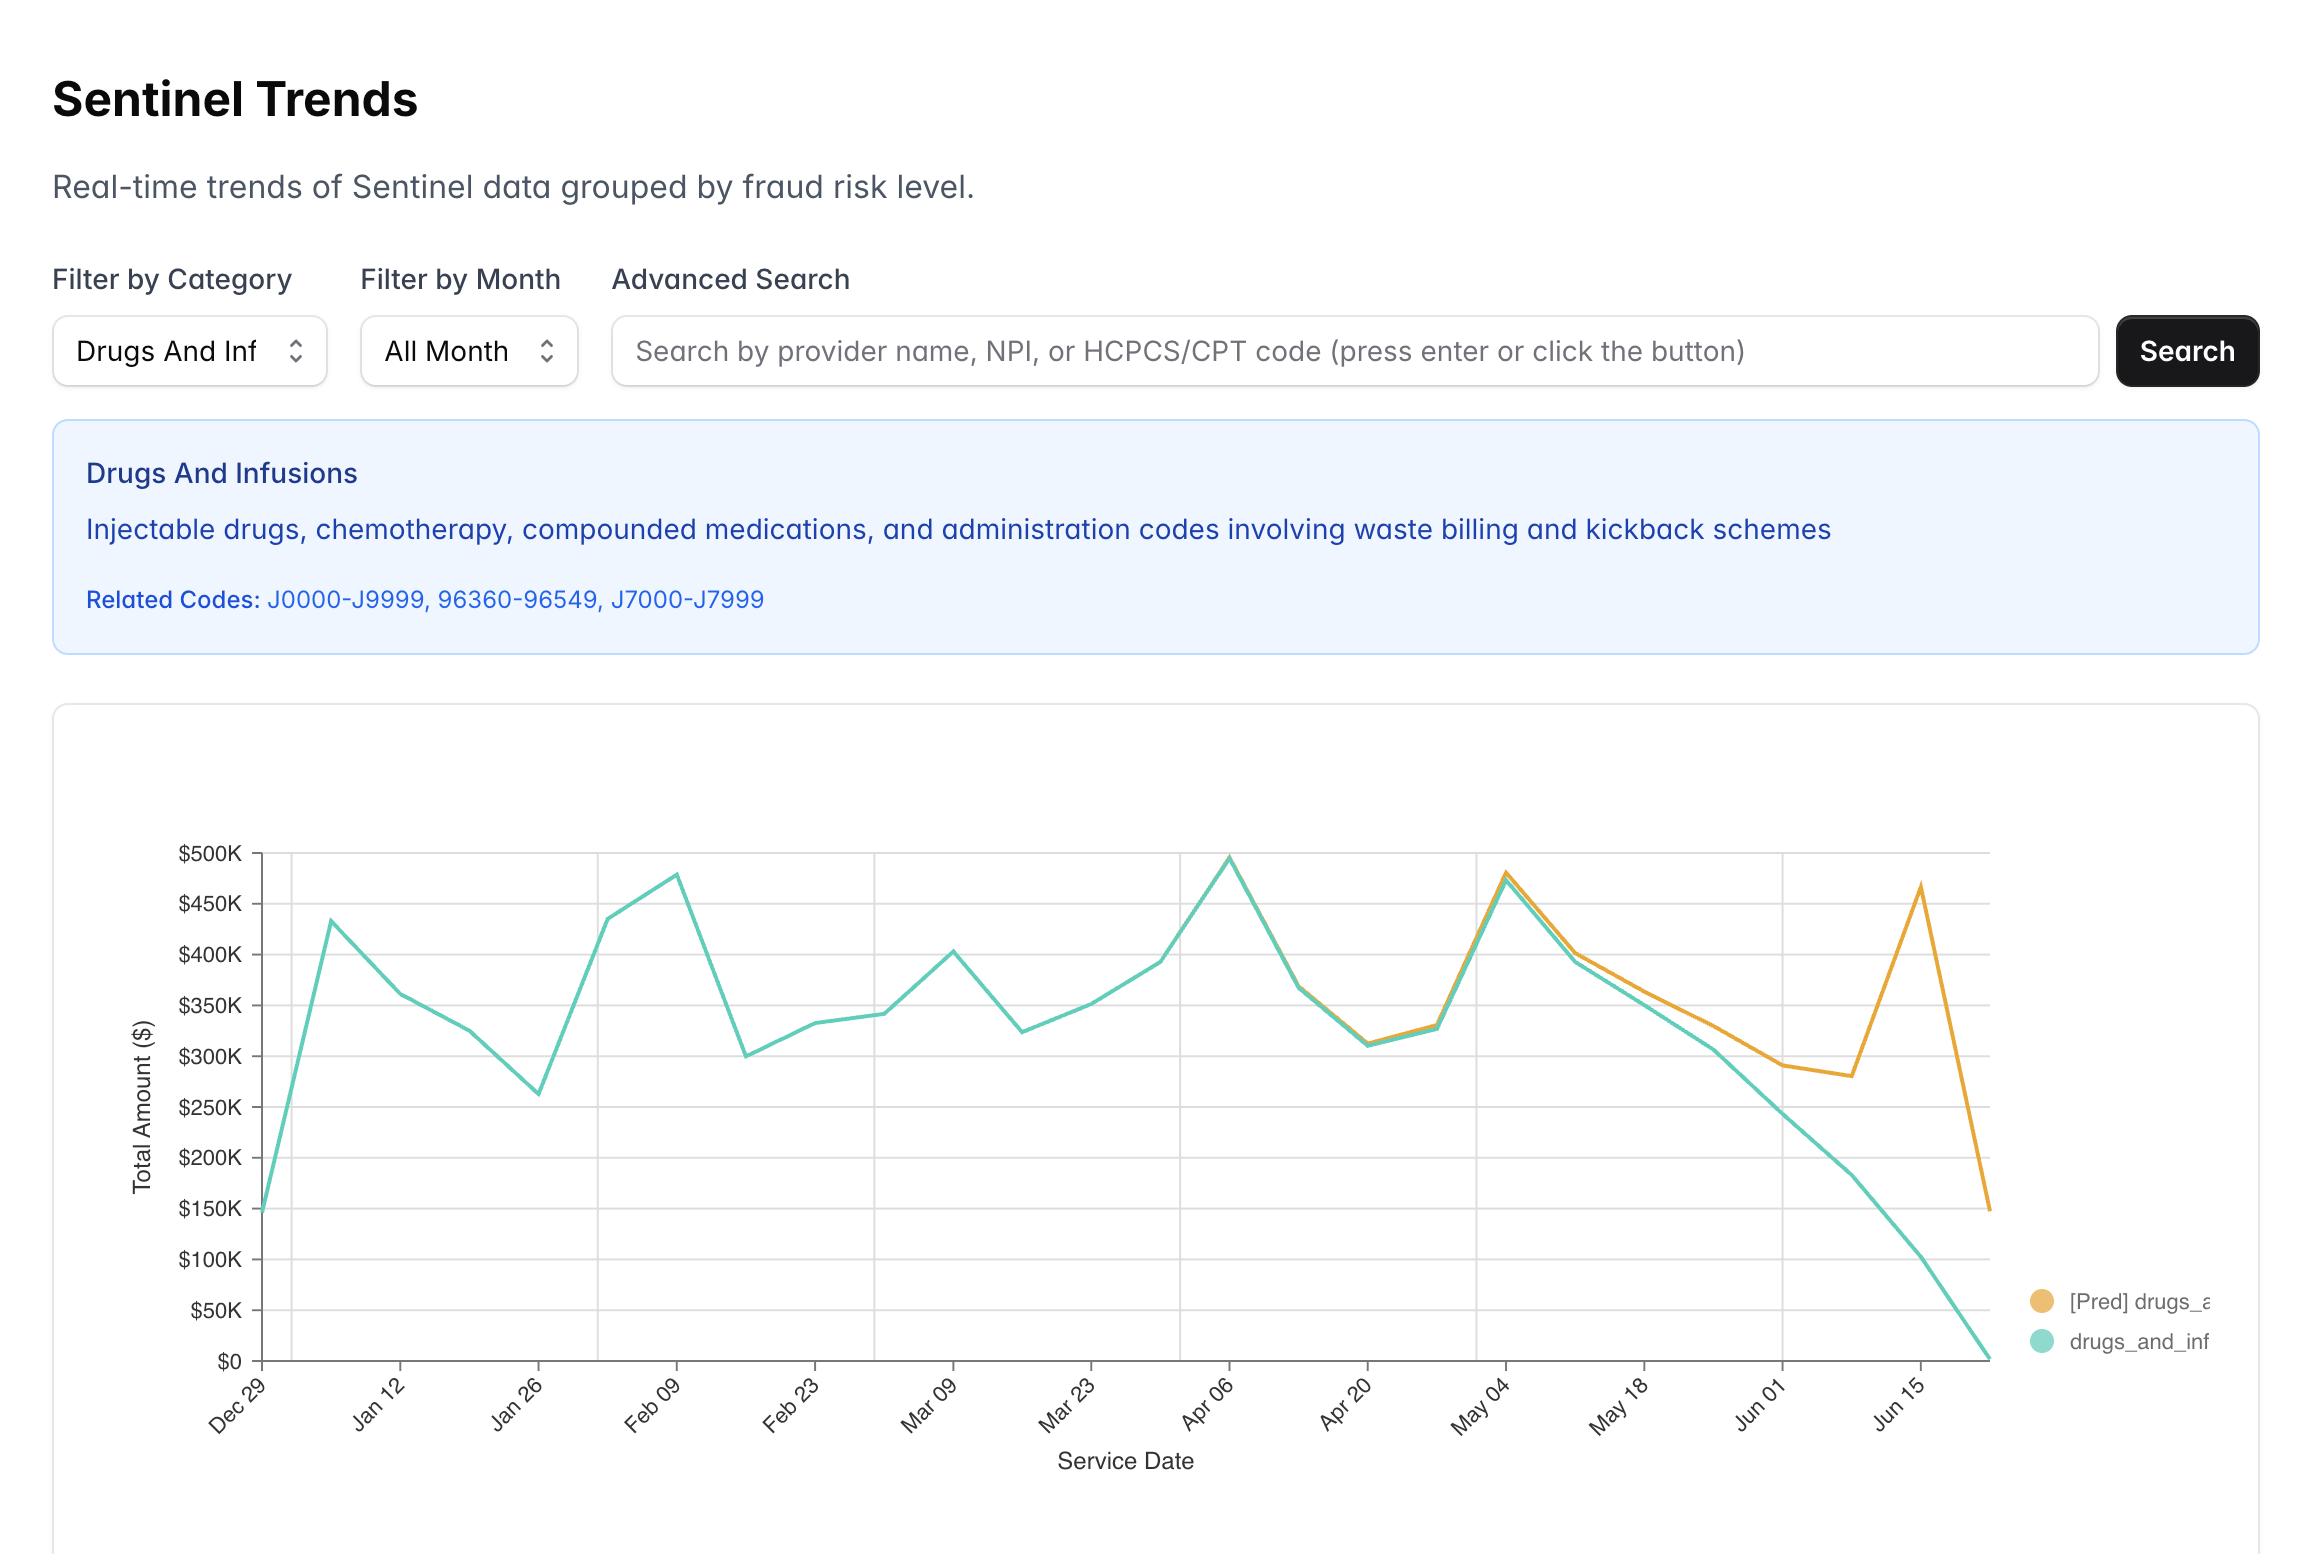
This chart shows this approach in action with injectable drugs, chemotherapy, and compounded medications. The teal line represents actual claims received, the traditional view that most organizations rely on. Looking at this raw data, it appears utilization is declining significantly in recent months, which might lead to premature conclusions about reduced treatment volumes or program effectiveness.
The orange line tells a different story. This represents our enhanced completion factor estimate, accounting for the specific providers in this network and their historical filing patterns for complex drug administration codes. The estimate reveals that utilization volume is actually holding steady, but the claims simply haven't arrived yet due to the complex billing processes involved in drug and infusion services.
This distinction is critical for drug and infusion monitoring because these services often involve waste billing, kickback schemes, and complex prior authorization processes that create longer filing delays. Without our enhanced estimation, an organization might mistakenly reduce reserves or miss emerging fraud patterns simply because they're looking at incomplete data.
Real Impact Beyond Traditional Metrics
Our approach delivers significantly earlier detection of utilization anomalies, more reliable monthly forecasting, and substantial reductions in budget variance surprises. Most importantly, clients discover proactive intervention opportunities that simply weren't visible with traditional static approaches.
The dynamic grouping capability proves especially valuable for fraud detection and emerging pattern recognition, identifying suspicious utilization clusters before they become systemic problems.
The Bottom Line
Real-time utilization tracking transforms organizations from reactive to proactive. When you can see trends as they develop rather than after they've already impacted your finances, you can adjust provider networks, modify benefit designs, investigate potential fraud, and optimize care management programs while there's still time to make a difference.
How does your organization currently track utilization trends? If you're interested in seeing how Falcon's dynamic utilization tracking could improve your forecasting accuracy and financial planning, we'd love to show you what's possible.
Ready to explore partnership opportunities? Contact us to schedule a demonstration of our real-time utilization tracking capabilities.